

Prices
Market prices, from your own receipts
Price intelligence in Moneva starts from purchases you record with a quantity and a unit price (10 kg of rice at 2,000) and turns them into your price per unit at each market, shop or supermarket, in Kigali's districts and beyond, next to community medians of anonymised purchases. It never guesses a market price it has not seen.
- Price per kilo, litre, piece or packet
- Cheapest and dearest place for your basket
- Community medians of anonymised purchases
Your price per unit
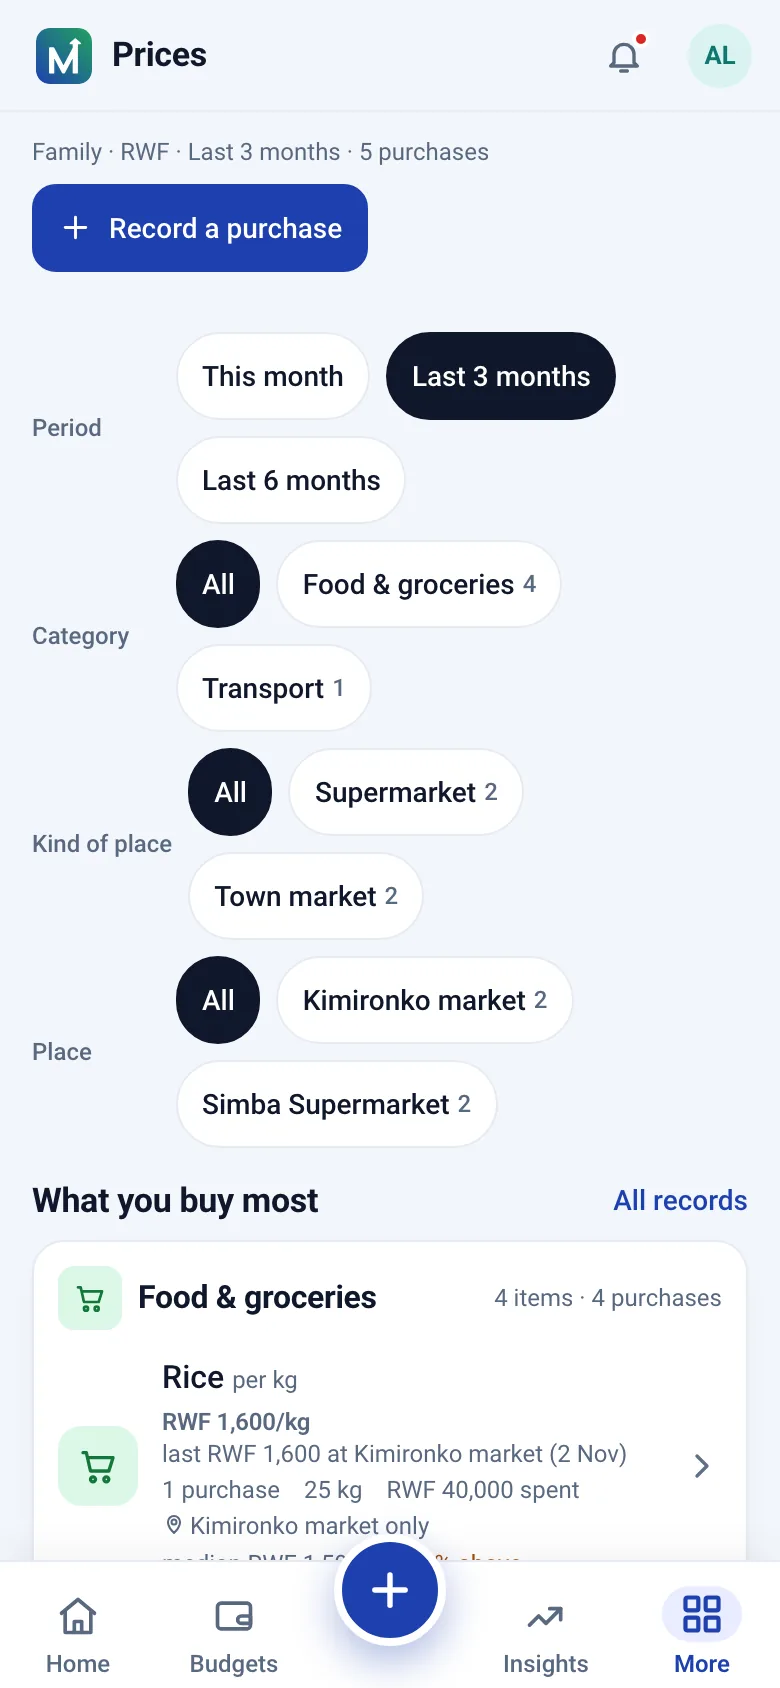
When you pay a planned expense, a Quantity × Unit price pair under the amount captures what you bought, prefilled from the plan and your own last price for that item. Grams normalise to kilograms and millilitres to litres; pieces, packets and bags stand on their own. The Prices page ranks what you buy most and shows, per item and unit, the quantity-weighted average you paid, the last price with where and when, the change against the previous period, the cheapest and the dearest place with the saving per unit between them, and a six-month trend of your own monthly medians.
Signals that state their rule
At most five one-line signals sit above the list, each with the figures and the rule behind it: Expensive right now when the last price is at least 10% above your average for the period, Good deal when it is 10% below, Cheapest for your basket for the place that wins the most items, Rising or Falling when the latest monthly median moves 5% against the previous month, Above or Below the community when your average sits 5% from the visible median, and Buy at the market when two kinds of place differ by 10% or more for the same item.
Community medians, anonymised
A scheduled job turns purchases into monthly aggregates per item, unit, currency, district and kind of place: the median, the middle half (p25 to p75), the number of purchases and the number of distinct spaces. A figure is shown only when it rests on five or more purchases from three or more spaces; rows carry no household, user, place or label; a space's own private items never take part; and nothing older than six months is presented as current. The comparison says, for example, that you paid 5% more than the community median around Gasabo, and leaves the decision to you.
Markets, shops and districts
Say where you bought something and it becomes a place of your space: Kimironko market, a supermarket, a village market, a restaurant, an online shop. For Rwanda the district is chosen from the thirty districts and the sector is free text, with the sectors of the City of Kigali suggested; abroad you type the city. The district is the only place text that ever crosses spaces, which is what lets figures group around Gasabo or Nyarugenge without naming anyone's shop.
Where prices show up
The Prices page carries the full picture with filter chips for category, kind of place, place, district, unit and currency. Each item has its own page: what you paid, where you paid, your purchases, your six-month prices, the community median with its middle half, prices by kind of place around your district and the market median over six months. The Insights page shows the top signals and your basket, and a stock item links to its price page.
Step by step
Know your prices in Moneva
The Know your prices journey from the Help page.
- Pay a planned expense and fill in Quantity × Unit price under the amount.
- Something not planned: add each item with its quantity and price.
- Say where you bought it, so prices group by place and district.
- Open Prices to compare places, periods and the community median.
In short
Plain facts
- Every purchase recorded in Moneva with a quantity and a unit price becomes a price per unit for that item; grams normalise to kilograms and millilitres to litres.
- Community figures are medians of anonymised purchases, shown only from five or more purchases across three or more spaces, by district and kind of place.
- Community rows carry no household, user, place or label, and nothing older than six months is presented as current.
- For Rwanda a place's district is one of the thirty districts; it is the only place text that crosses spaces.
- Signals state their rule: 10% for Expensive right now and Good deal, 5% for Rising, Falling and the community comparison.
Questions
Questions people ask
Does Moneva publish the price of rice in Kigali?
It shows community medians of anonymised purchases recorded by Moneva users, by district and kind of place, once five or more purchases from three or more spaces exist for that item and month. It is not an official price index.
Can someone see what I paid?
Only members of your space who may see your transactions. Community figures are medians over at least five purchases from three spaces and carry no name, place or label, so your price is never shown to others.
Which units are compared?
Weights with weights and volumes with volumes: grams become kilograms, millilitres become litres. Pieces, packets, bags and bottles are compared only with themselves, and never across currencies.
Does it work outside Rwanda?
Your own prices work anywhere: choose the country and type the city. Grouping by district exists for Rwanda's thirty districts.
Related pages
Record one purchase with its price per kilo
Create an account, pay a planned expense with Quantity × Unit price and say where you bought it.